Behind the Numbers: Survey Questions and Methodology Guide
Methods
Participation
PH WINS 2024 was conducted in 48 state health agencies (SHAs) and nearly 1,200 local health departments (LHDs) in 49 states. Each participating health department submitted a list of the names and email addresses of all staff in their department for a total of 159,627 individuals. PH WINS was sent to all individuals on September 9, 2024, via Qualtrics, a web-based survey platform, and the survey closed on January 17, 2025. After accounting for bounced or failed emails and those that were reported to have left their organization, the number of possible respondents was 153,552.
PH WINS received 56,595 responses, a 37% response rate. This response rate is slightly higher than in 2021 (35%) but lower than in 2017 (48%). The figure below describes the participation in each type of health department and the final nationally representative sample. Data were cleaned, managed, and analyzed in STATA (version 17.0; StataCorp LLC, College Station, Texas). Balanced repeated replication weights were constructed to account for the complex survey design and to adjust for nonresponse.
Analysis Considerations
- Sampling design: Non-response assessment shows that primary potential for bias lies with both differential non-response individuals, and potentially from with the participation or non-participation of invited agencies. Balanced repeated replication weights and broader post stratifications account for this complex sampling design, as does weight trimming. Nonetheless, this should be a consideration for those planning to use the data for national analysis.
- Response rates: Non-response bias is always a concern for surveys, particularly ones that assess sentiment and perception, such as PH WINS. PH WINS 2024 had a 37% response rate, which is slightly higher than in 2021, but lower than in 2017. For the first time, all local health departments across the nation, regardless of size, were eligible to participate in PH WINS. The increased sample size allowed for less one-on-one follow-up to increase response rates, and smaller local health departments typically respond at lower rates than larger local health departments. However, 56,595 was the largest number of responses PH WINS has ever received, and the open rate (57%) and completion rate once opened (76%) were on par with previous administrations of the survey. In 2021, the response rate was 35%, the email open rate was 40%, and the completion rate was 87%. In 2017, the response rate was 48%, the email open rate was 57%, and the completion rate was 85%.
- Staffing inclusion criteria: In 2021, the decision was made to include non-permanent employees in the nationally representative SHA-CO frame as many non-permanent employees were hired to increase the capacity of the workforce during COVID-19 response. This decision was carried forward to PH WINS 2024. However, non-permanent employees were excluded from the final nationally representative SHA-CO frame for PH WINS 2017 owing to 1) their small presence in the field and 2) the conceptual importance of focusing workforce development efforts on a permanent workforce. This change between 2017 and 2021 may have some implications for researchers wishing to make multi-cross-sectional comparisons across the different PH WINS administrations.
Interpreting Data
Interpreting Estimates
As described in the user guide, data labels are provided for each row in a graph. Those data labels represent the percentage or point estimate for each row in the graph, which corresponds to a specific response for a survey question.
Interpreting Confidence Intervals
As described in the user guide, confidence intervals are provided for each estimate on the dashboard.
In some cases, you may see confidence intervals with large widths (>15%), meaning that we can be less confident about the result. These appear when the overall population size is small. While the estimates are still accurate, they should be interpreted and used with some caution.
Suppression Rules
To protect respondent confidentiality and ensure data reliability, suppression rules have been applied to the survey results:
- Response Suppression: Survey responses with fewer than 10 responses are suppressed and not reported to prevent the potential identification of individual respondents. Only questions with 10 or more responses are included in the dashboard.
- Filtering Criteria: Users of the PH WINS dashboard can filter results by various demographics and workforce characteristics. However, filters are only applied if 10 or more respondents meet the selected criteria for a given filter.
Combined View
On the PH WINS dashboard, categories may appear in a combined view rather than showing a full breakdown of subcategories. This approach is used to ensure respondent confidentiality and maintain data reliability, particularly for agencies with smaller staff sizes.
Why is data combined?
When there are fewer than 10 responses in a specific subcategory, those responses are grouped into a broader category to prevent potential identification of individuals. This is most common for demographic categories, such as race and ethnicity, where data may be reported as “White” and “BIPOC” rather than individual race/ethnicity groups.
How to interpret the combined view?
If you see a combined category on the dashboard, it means that individual subcategories did not meet the minimum reporting threshold and have been grouped together. This ensures agencies can still analyze workforce trends while protecting respondent privacy. By applying these data suppression and combination rules, PH WINS maintains the integrity of the data while providing meaningful insights for workforce development.
Available Longitudinal Data
Using the “filter by” option you are able to select “year” to see all years of data available. Please note that 2014 data is not available on the dashboard, since the survey has grown significantly since its initial administration in 2014. If you are seeking 2014 data, please fill out the data request form.
Additionally, the survey questions have also changed over the years to meet the evolving needs of the workforce and standards in survey design. If you do not see data for a particular year, it is likely that data does not exist or was not compatible with previous results. For any specific questions, please contact us.
Below is a summary of changes between the 2021 and 2024 surveys.
Addition of the Following Questions/Question Topics:
- Burnout: a new burnout question assesses employees' level of exhaustion and stress, replacing the previous Oldenburg Burnout Index from 2017.
- Fairness in the Workplace: four new items adapted from the Great Places to Work survey assess whether employees are treated fairly regardless of age, race, gender, or sexual orientation.
- Student Loan Burden: four new questions measure student loan burden and its impact on workforce retention.
- Satisfaction with Work Unit, Supervisor, and Benefits: three new satisfaction questions expand on existing satisfaction measures.
- Workforce Engagement (Thriving from Work Questionnaire – Short Form): replaces the Workplace Engagement Matrix with a validated measure of work-related well-being.
- Training Needs Assessment: two new questions assess whether employees have time and resources to address training needs.
- New Survey Modules for Specific Workforce Groups:
- Epidemiologists – Focuses on epidemiology skills and career pathways.
- Employees age 35 and under – Focuses on pathways to governmental public health careers.
- Supervisors, managers, and executives – Focuses on leadership development and training needs.
Revision of Existing Questions:
- Revision of gender, sex, and race and ethnicity questions: aligns with 2024 OMB recommendations
Removal of Questions/Question Topics:
- Workplace Engagement Matrix (replaced with the Thriving from Work Questionnaire)
- Intent to Leave Follow-up Questions: job applications, retirement planning, and further education
- Satisfaction with Job Security
- External Harassment Questions
- COVID-19-Specific Questions
Survey Questions
This section provides the specific survey questions and response options that directly correspond to the data for the topic you are viewing. The PH WINS 2024 dashboards do not include all survey questions asked, and this document only contains the questions relevant to the data displayed. To access the full PH WINS 2024 survey instrument, click here. To request additional data not shown in the dashboards, submit a data request here.
Demographics
The Demographics topic examines the personal attributes of the workforce such as sex, race and ethnicity, age, educational attainment, public health training, and student loan burden.
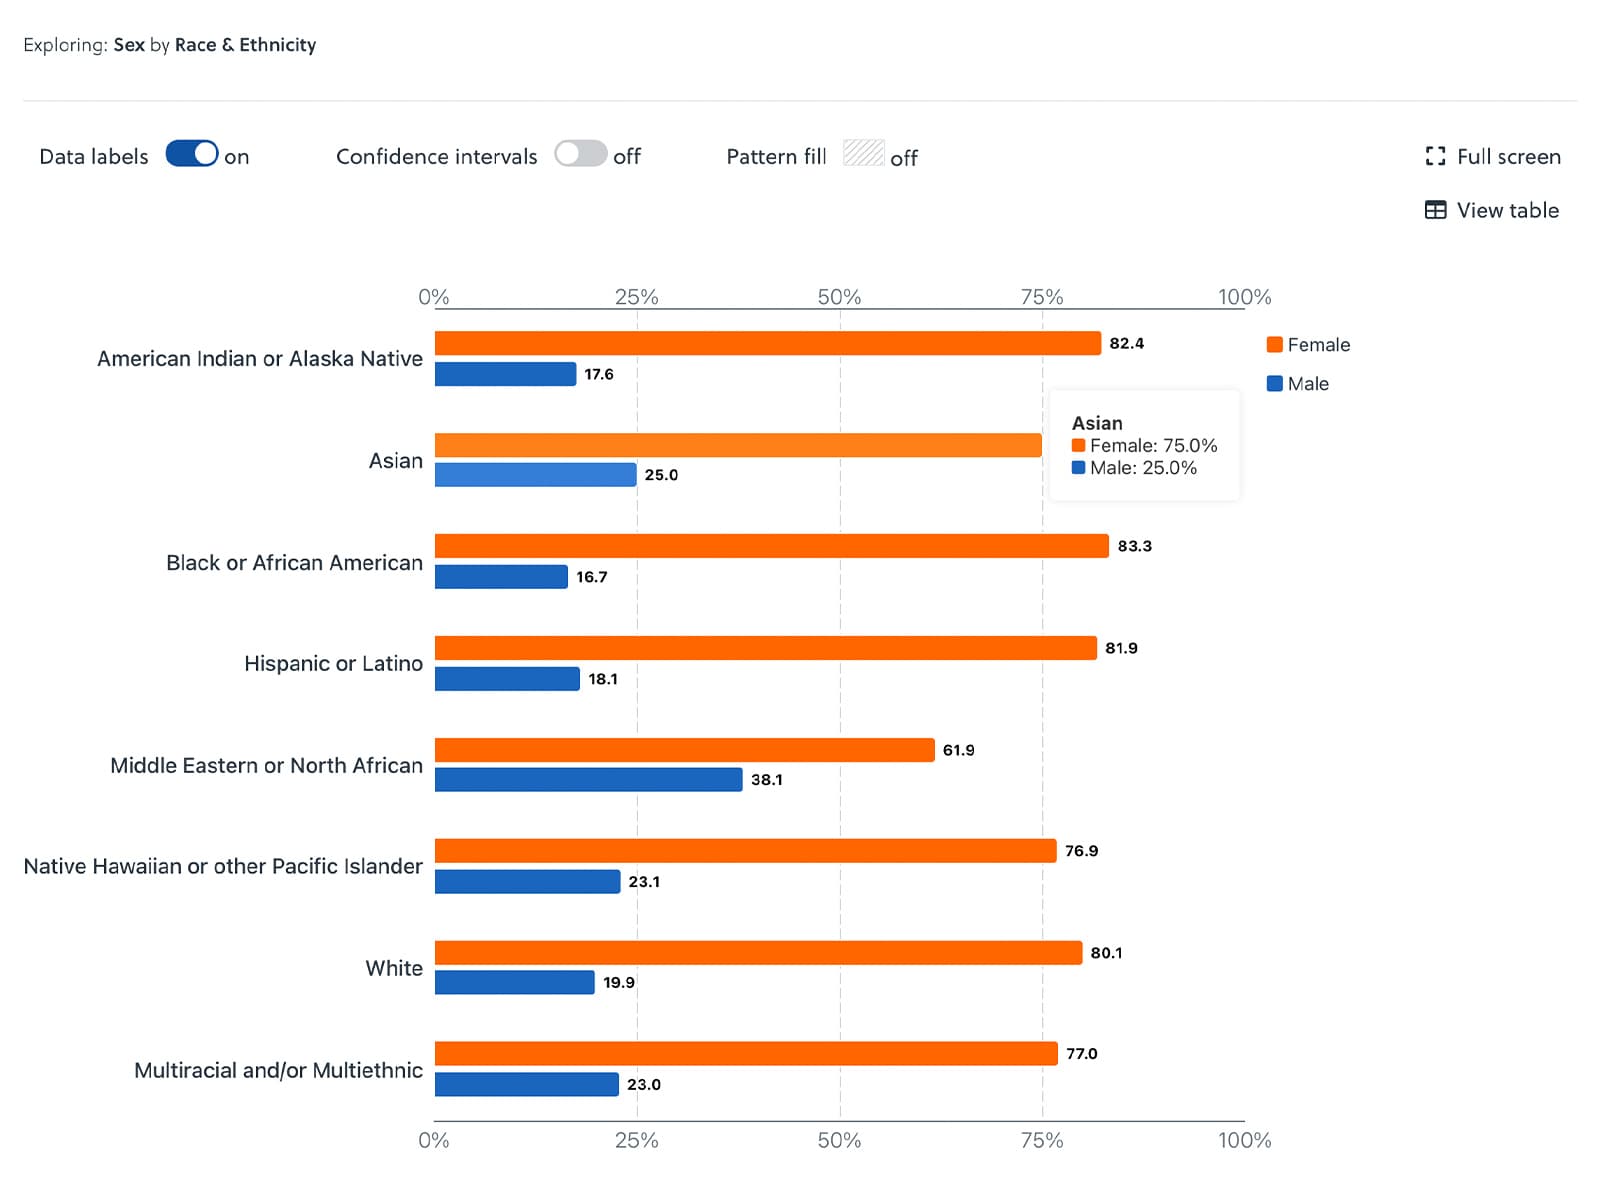
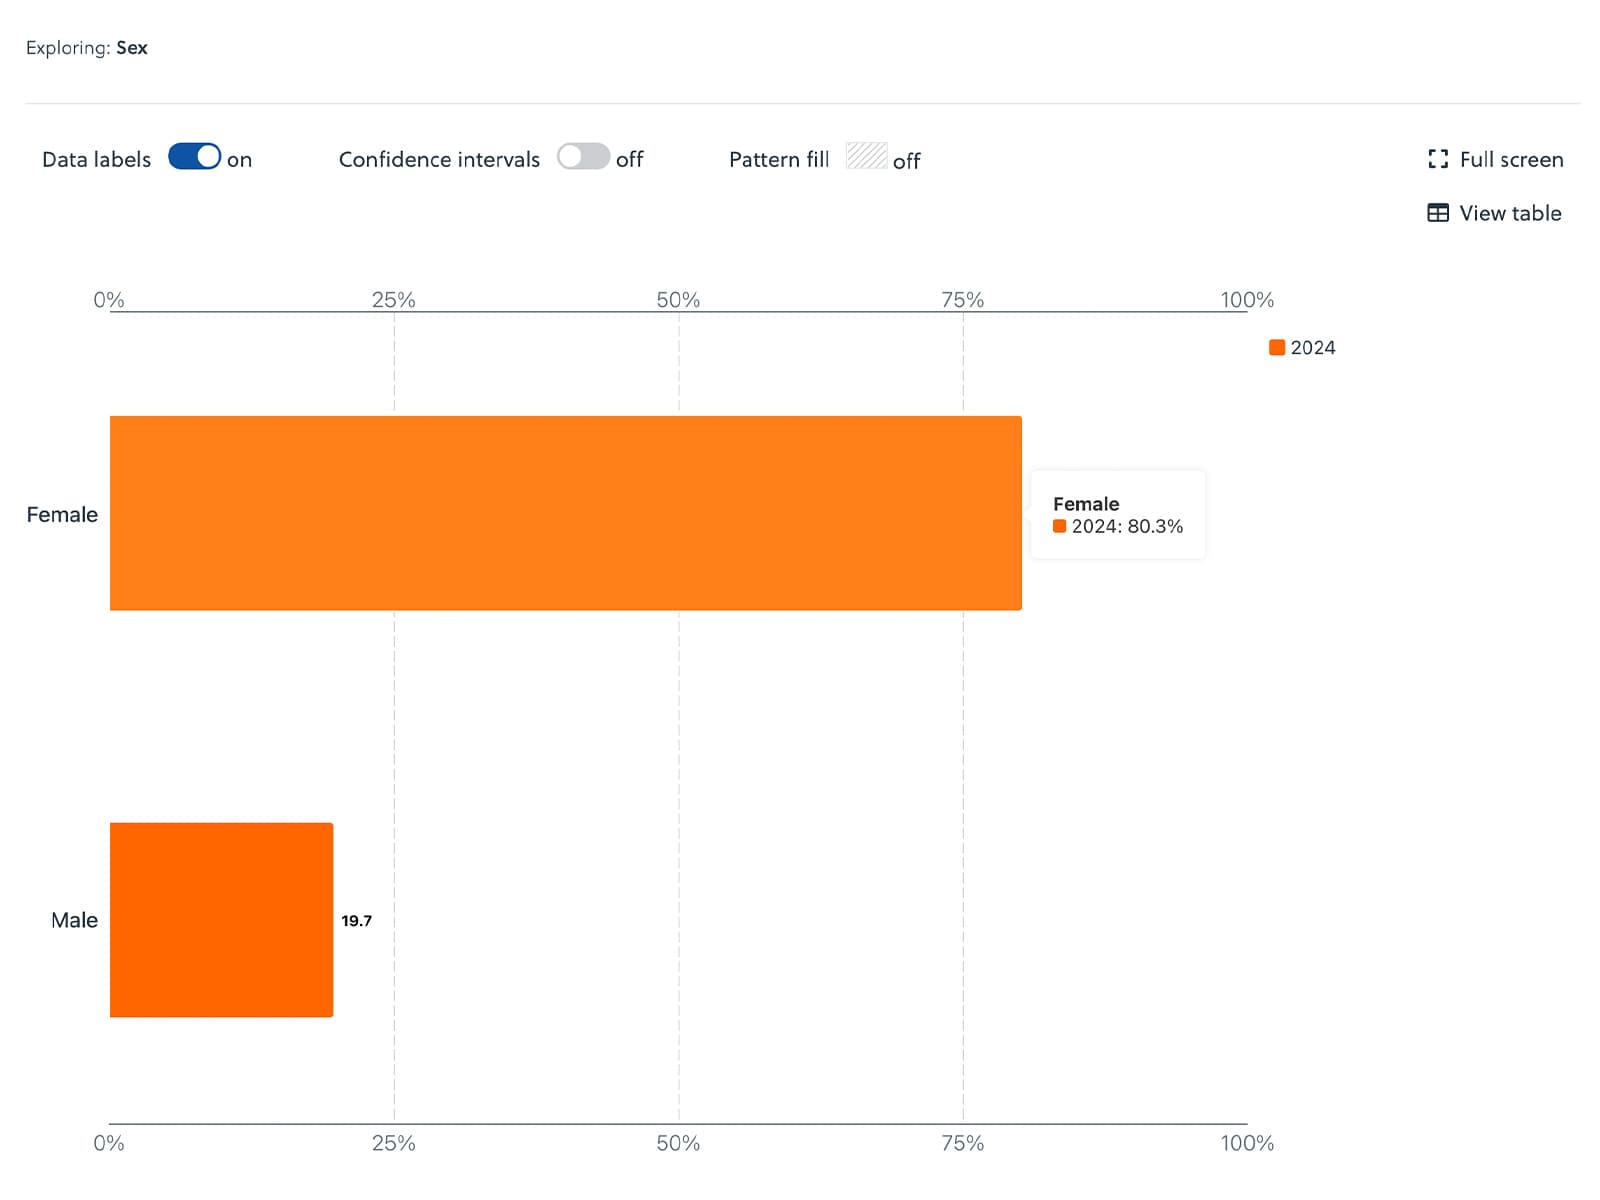
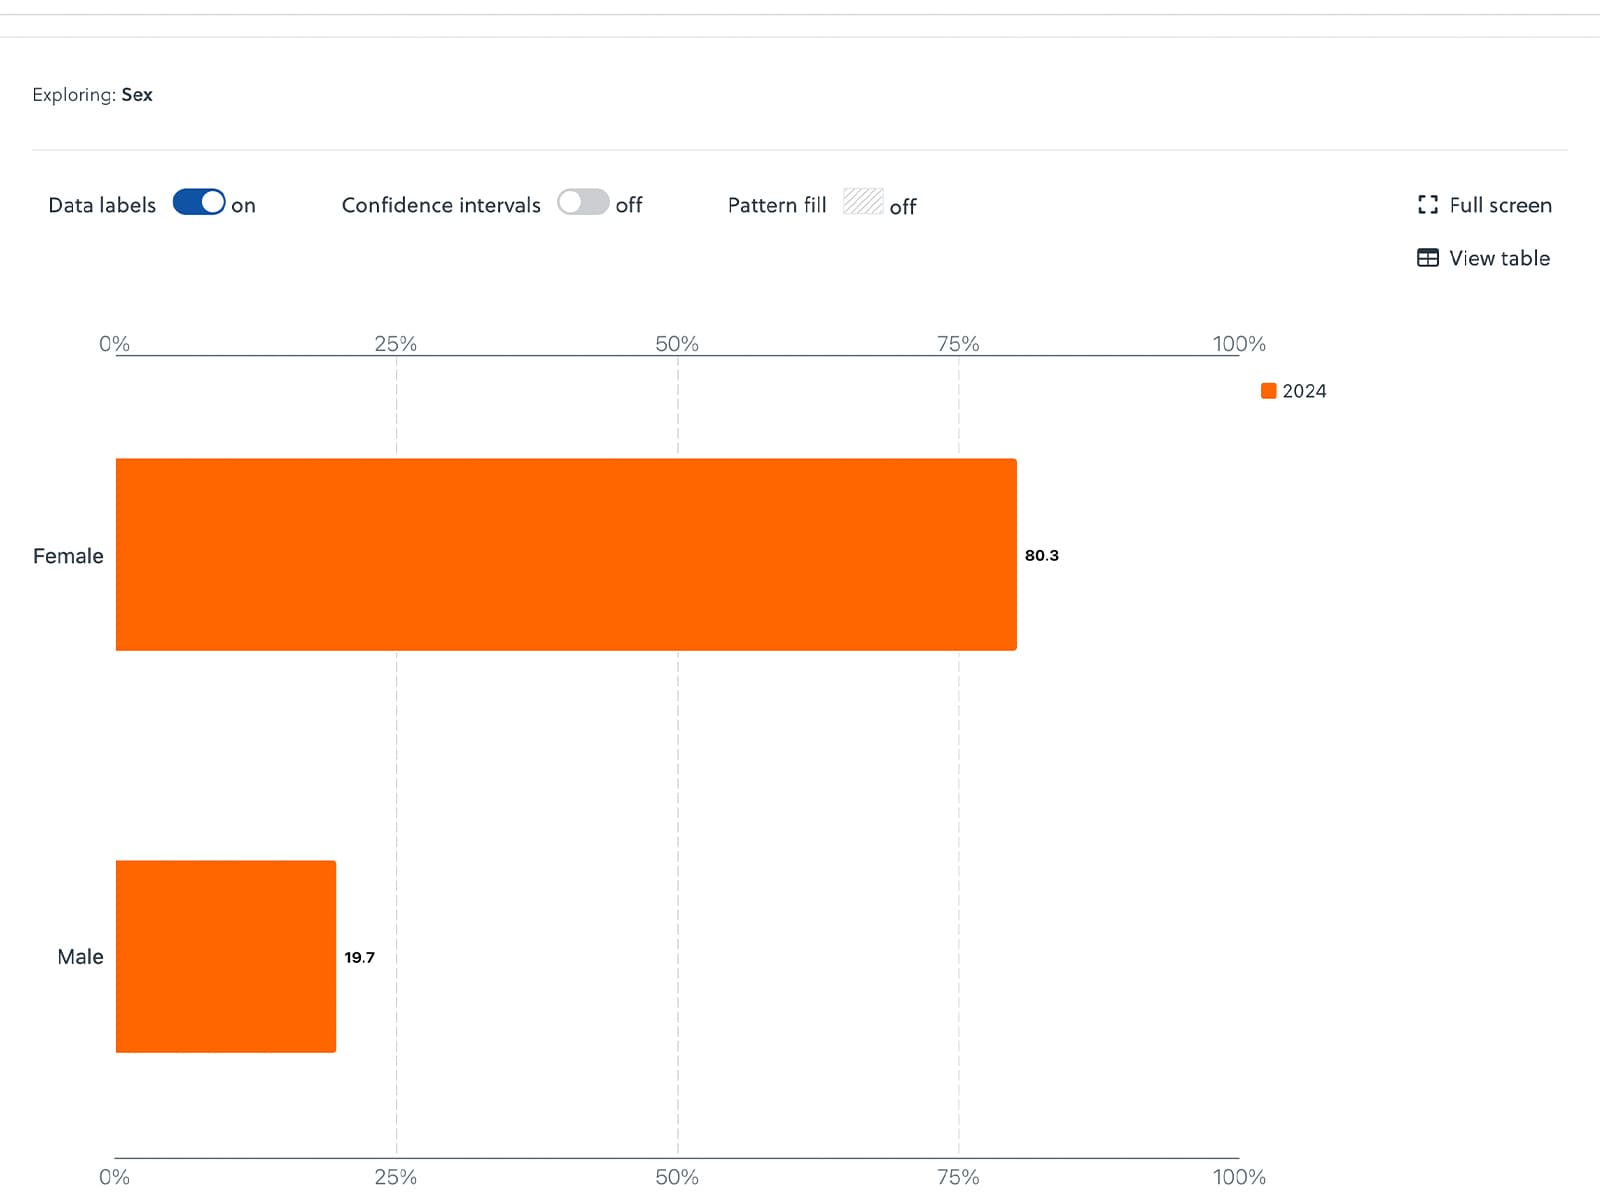
Sex
Respondents were asked the following question related to their sex assigned at birth. Understanding this information is important for ensuring that all employees have an equal opportunity to succeed.
Filter Option: Did you know you could filter by this item? Try filtering by Sex or refining your population to male or female to explore your PH WINS data in a different way. Learn more about how to use the filters here.
Q28. What sex were you assigned at birth? (Longitudinal data available)
- Male
- Female
Race & Ethnicity
Respondents selected one or more of the following race/ethnicity categories: American Indian or Alaska Native, Asian, Black or African American, Hispanic or Latino, Middle Eastern or North African, Native Hawaiian or other Pacific Islander, or White. Understanding the racial identities of the workforce is an important step to ensure that all voices are heard.
Combined view note: If you are seeing a combined view, it means that a subcategory has fewer than 10 responses and has been grouped into a broader category to protect respondent confidentiality. Individual subcategories did not meet the minimum reporting threshold and were combined to maintain privacy while still providing meaningful workforce insights.
Filter Option: Did you know you could filter by this item? Try filtering by Race and Ethnicity or refining your population to American Indian or Alaska Native, Asian, Black or African American, Hispanic or Latino, Middle Eastern or North African, Native Hawaiian or other Pacific Islander, White, or Multiracial and/or Multiethnic to explore your PH WINS data in a different way. Learn more about how to use the filters here.
Q30. Please select the race/ethnic category or categories with which you most identify (select all that apply).
- American Indian or Alaska Native
- Asian
- Black or African American
- Hispanic or Latino
- Middle Eastern or North African
- Native Hawaiian or other Pacific Islander
- White
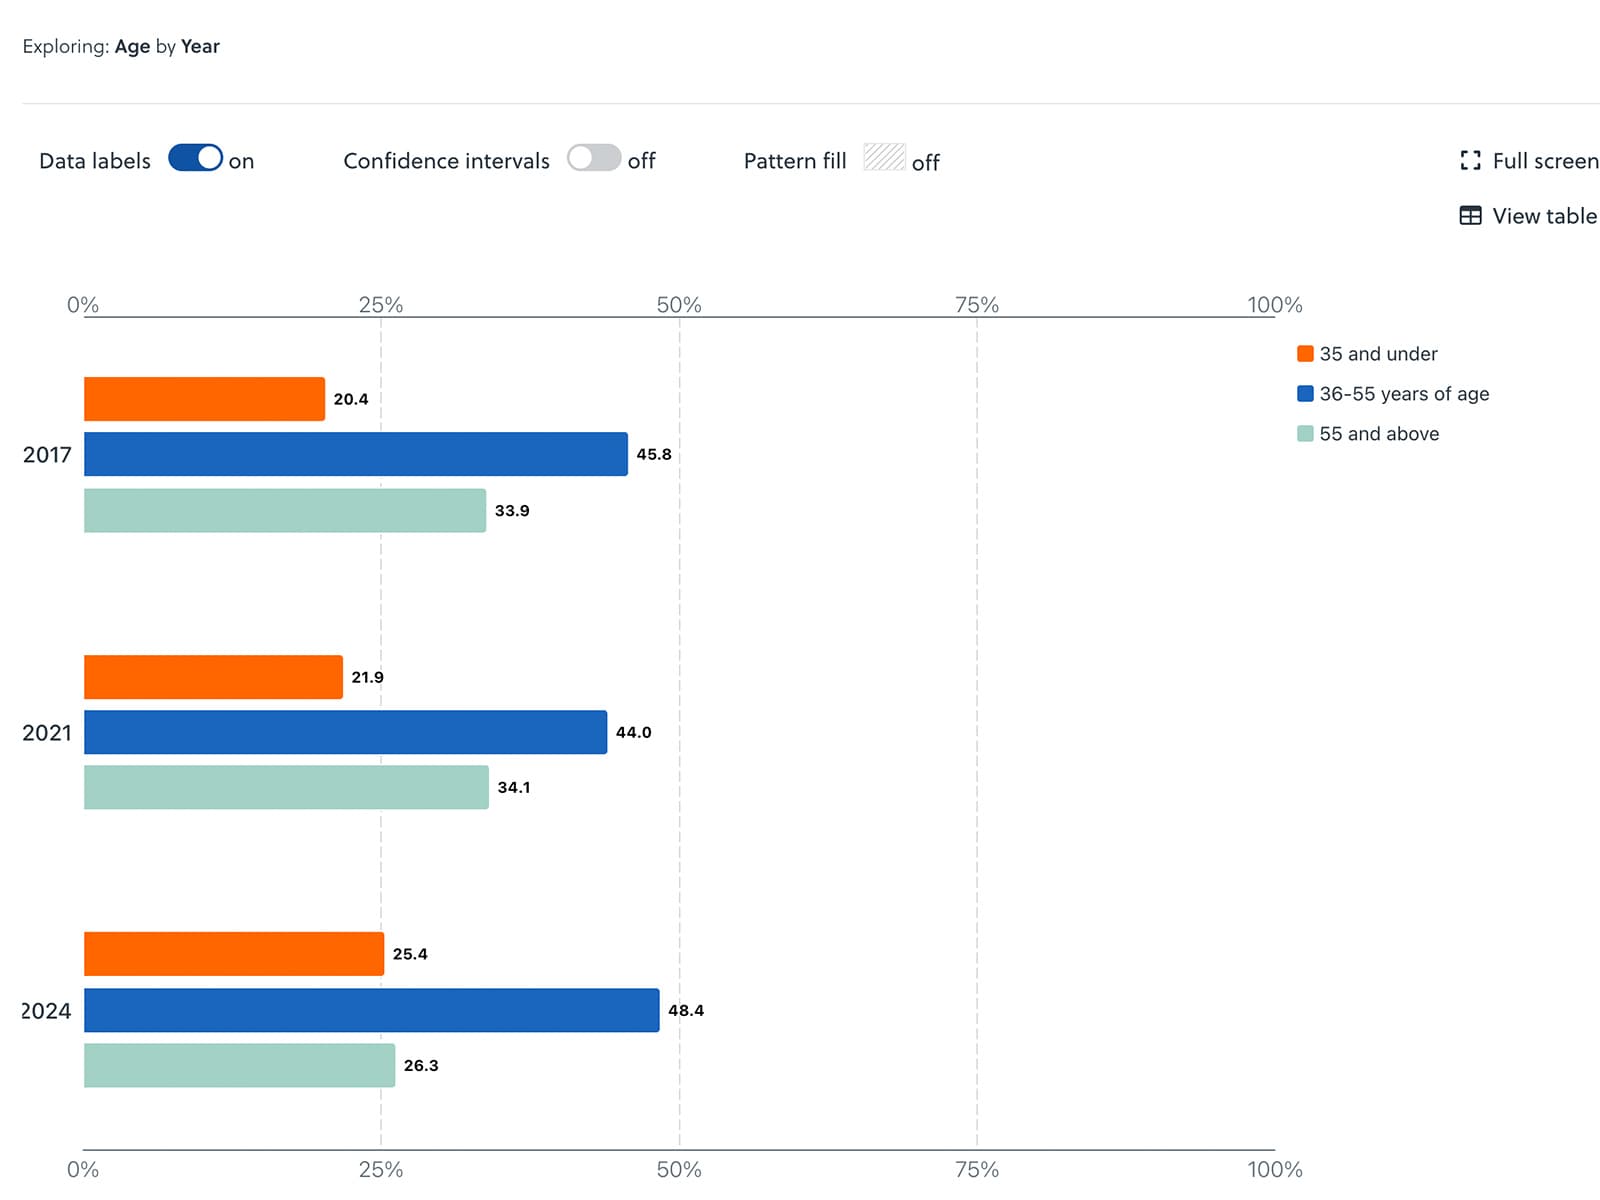
Age
Respondents were asked to identify their age. Understanding the age distribution of the workforce can help support cross-generational collaboration and knowledge sharing.
Filter Option: Did you know you could filter by this item? Try filtering by Age or refining your population to 35 and under, 36-55 years of age, or 55 and above to explore your PH WINS data in a different way. Learn more about how to use the filters here.
Q31. What is your age in years? Please round to the nearest whole year. [write in]
Educational Attainment
Respondents were asked to identify their educational attainment. Understanding this information helps leverage expertise, support workforce development, and assess recruitment needs.
Filter Option: Did you know you could filter by this item? Try filtering by educational attainment or refining your population to no college degree, associates, bachelors, masters, or doctoral to explore your PH WINS data in a different way. Learn more about how to use the filters here.
Q34. Please indicate which degrees you have attained. Check all that apply.
- High school or equivalent
- Associate’s degree in nursing
- Other associate degree
- BS/BA
- BSN
- BSPH/BAPH
- Other baccalaureate degree
- MA/MS
- MBA
- MHSA
- MPA
- MPP
- MPH
- MSN
- MSW
- Other master’s degree
- DDS/DMD
- DrPH
- PhD in Public Health
- ScD in Public Health
- Other public health doctorate
- DNP
- DVM/VMD
- JD
- MD/DO, or international equivalent
- PharmD
- PhD/ScD/other non-public health doctorate
- I am currently pursuing a degree
Public Health Training
Respondents who reported having other associate, BS/BA, Other bachelor’s degree, MA/MS, Other master’s degree, PhD, or ScD, were asked whether their major or concentration was in public health. Understanding the educational background of the workforce helps agencies tailor professional development opportunities and assess recruitment needs.
Filter Option: Did you know you could filter by this item? Try filtering by Public Health Training or refining your population to no public health degree or public health degree to view your PH WINS data in different way. Learn more about how to use the filters here.
Q34d. [Show if Other associate, BS/BA, Other bachelor’s degree, MA/MS, Other master’s degree, PhD, or ScD] Was the major or concentration for your _________ [pipe in each degree] public health?
- Yes
- No
Student Loan Burden
Respondents were asked to report the total amount they borrowed in student loans. Understanding this provides an opportunity to explore support programs that promote financial wellness and help employees manage student loan debt.
Q36. Including loans for your own and others’ education, about how much in student loans have you borrowed in total? This includes loans which no longer have a balance. (Dropdown)
- I did not take out any loans for my own or others’ education.
- $0.01 - $10,000
- $10,000.01 - $20,000
- $20,000.01 - $30,000
- $30,000.01 - $40,000
- $40,000.01 - $50,000
- $50,000.01 - $60,000
- $60,000.01 - $70,000
- $70,000.01 - $80,000
- $80,000.01 - $90,000
- $90,000.01 - $100,000
- $100,000.01 - $110,000
- $110,000.01 - $120,000
- $120,000.01 - $130,000
- $130,000.01 - $140,000
- $140,000.01 - $150,000
- $150,000.01 - $160,000
- $160,000.01 - $170,000
- $170,000.01 - $180,000
- $180,000.01 - $190,000
- $190,000.01 - $200,000
- $200,000.01 - $210,000
- $210,000.01 - $220,000
- $220,000.01 - $230,000
- $230,000.01 - $240,000
- $240,000.01 - $250,000
- $250,000.01 or more
The following two questions are not shown on the dashboard.
Q36b. [Show if question above is not 0] As of today, including loans for your own or others’ education, about how much student loans remain ? (Dropdown)
- $0
- $0.01 - $10,000
- $10,000.01 - $20,000
- $20,000.01 - $30,000
- $30,000.01 - $40,000
- $40,000.01 - $50,000
- $50,000.01 - $60,000
- $60,000.01 - $70,000
- $70,000.01 - $80,000
- $80,000.01 - $90,000
- $90,000.01 - $100,000
- $100,000.01 - $110,000
- $110,000.01 - $120,000
- $120,000.01 - $130,000
- $130,000.01 - $140,000
- $140,000.01 - $150,000
- $150,000.01 - $160,000
- $160,000.01 - $170,000
- $170,000.01 - $180,000
- $180,000.01 - $190,000
- $190,000.01 - $200,000
- $200,000.01 - $210,000
- $210,000.01 - $220,000
- $220,000.01 - $230,000
- $230,000.01 - $240,000
- $240,000.01 - $250,000
- $250,000.01 or more
Q37. Of your current student loan balance, approximately what percent is:
- From private loans (Loan from private bank, loan from school, loan from friend or family)
- From Federal direct loans (Stafford federal student loan (subsidized or unsubsidized)
- PLUS federal student loan for parents; Federal consolidation loan; PLUS federal student loan for graduate students)
- From other Federal sources loans (Perkins federal loan; Federal Family Education Loan;
- From other governmental (but non Federal) loans (e.g., State loan)
- From all other loans
Workforce Characteristics
The Workforce Characteristics topic examines the general characteristics of respondents’ jobs and the work they do.
Setting
Respondents were asked to identify the setting they work in. Understanding this information helps illustrate the critical role that different levels of government play in public health and presents an opportunity to enhance collaboration and resource sharing for improved health outcomes. "States" represents those working in a state health agency central office; "All LHDs" represents those working in local health departments; "Large LHDs" represents those working in local health departments with a staff size of more than 25 and serving a population of more than 250,000; "Medium LHDs" represents those working in local health departments with a staff size of more than 25 and serving a population between 25,000 and 250,000; "Small LHDs" represents those working in local health departments with a staff size of less than 25 or serving a population of 25,000 or less.
Filter Option: Did you know you could filter by this item? Try filtering by Setting or refining your population to SHA-CO or local to view your PH WINS data in a different way. Learn more about how to use the filters here.
Q38. Please specify your setting.
- City/Town Health Agency
- County Health Agency
- Other Public Health Local Agency
- Multi-city Health Agency
- Multi-county Health Agency
- State Health Agency - Central Office
- State Health Agency - Local or Regional Office
- Other State Agency, not Health Agency
- Hospital or Primary Care Clinic
- Inpatient or Outpatient Clinical Setting
- Other [please specify]
Q39. Please specify your employer.
- Local government
- State government
- Federal government
- Non-governmental
Staff Size
This topic is only available when viewing a State’s local health department dashboard. This is a password protected view.
Agencies participating in PH WINS submitted a staff list containing employee information such as names and email addresses. This data was used to determine agency staff size. Understanding the distribution of employees across local health departments by staff size presents an opportunity to leverage strengths and resources to enhance effectiveness and impact for health departments of all sizes.
Combined view note: If you are seeing a combined view, it means that a subcategory has fewer than 10 responses and has been grouped into a broader category to protect respondent confidentiality. Individual subcategories did not meet the minimum reporting threshold and were combined to maintain privacy while still providing meaningful workforce insights.
Filter Option:Did you know you could filter by this item? Try filtering by Staff Size or refining your population to <20, 20-99, or 100+ to view your PH WINS data in a different way. Learn more about how to use the filters here.
Population Size Served
This topic is only available when viewing a State’s local health department dashboard. This is a password protected view.
Using data from other sources, the population size served by agencies participating in PH WINS was determined. Understanding this distribution helps identify opportunities to leverage strengths and resources to improve health outcomes for communities of all sizes.
Combined view note: If you are seeing a combined view, it means that a subcategory has fewer than 10 responses and has been grouped into a broader category to protect respondent confidentiality. Individual subcategories did not meet the minimum reporting threshold and were combined to maintain privacy while still providing meaningful workforce insights.
Filter Option:Did you know you could filter by this item? Try filtering by Population Size Served or refining your population to <25,000, 25,000 – 249,000, or 250,000+ to view your PH WINS data in a different way. Learn more about how to use the filters here.
Filter Option: Rurality
This refine to option is only available when viewing a State’s local health department dashboard. This is a password protected view.
Refine your population to rural or urban to view local health departments that fall into either of these categories.
Rurality ( Refine To options)
- Rural
- Urban
Note: Each census block is classified as either urban or rural based on the criteria outlined in the Federal Register Notice on Urban Area Criteria for the 2020 Census. The classification for each local health department (LHD) is determined by aggregating these blocks. If the majority of the area’s population falls within urban or rural blocks, the LHD is classified accordingly. The dashboard also includes the percentage of the population in each LHD that resides in urban vs. rural areas.
Supervisory Status
Respondents were asked to identify their supervisory status. Understanding this information helps assess workforce structure and informs professional development initiatives that support career advancement.
Combined view note: If you are seeing a combined view, it means that a subcategory has fewer than 10 responses and has been grouped into a broader category to protect respondent confidentiality. Individual subcategories did not meet the minimum reporting threshold and were combined to maintain privacy while still providing meaningful workforce insights.
Filter Option: Did you know you could filter by this item? Try filtering by Supervisory Status or refining your population to non-supervisors, supervisors and managers, or executives to view your PH WINS data in a different way. Learn more about how to use the filters here.
Q1. What is your supervisory status?
- Non-supervisor: you do not supervise other employees
- Supervisor: you are responsible for employees' performance appraisals and approval of their leave, but you do not supervise other supervisors
- Manager: you are in a management position and supervise one or more supervisors
- Executive: member of Senior Executive Service or equivalent
Job Type
Respondents selected the classification that best represented their current rolefrom a list of more than 70 job classifications. "Other" responses were recoded into the appropriate category where possible. Understanding this distribution highlights key workforce areas, reflecting the workforce’s priorities.
Data was analyzed to align job categories with existing job classifications, such as those defined for the CDC’s Public Health Infrastructure Grant and the federal Standard Occupational Classifications. Below is the crosswalk of job classifications to job categories (“types”).
Administrative Staff & Leadership
Application/Software Developer
Attorney or Legal Counsel
Business Support - Accountant/Fiscal
Business Support Services - Administrator
Clerical Personnel - Administrative Assistant
Clerical Personnel - Secretary
Custodian
Customer Service/Support Professional
Database Manager/Data Storage Architect
Department/Bureau Director
Deputy Director
Facilities or Operations Worker
Grants or Contracts Specialist
Health Officer
Human Resources Personnel
Information Systems Manager/Information Technology Specialist
Other Business Support Services
Other Data/Computer Scientist
Other Executive Leadership
Public Health Agency Director
Quality Improvement Worker
Clinical, Behavioral, & Social Services
Community Health Worker
Disability Claims/Benefits Examiner or Adjudicator
Emergency Medical Technician/Advanced Emergency Medical Technician/Paramedic
Home Health Aide
Licensed Practical or Vocational Nurse
Medical Examiner
Mental Health or Substance Abuse Counselor
Nurse Practitioner
Nutritionist or Dietitian
Other Community Health Professional
Other Health Professional/Clinical Support Staff
Peer Counselor
Pharmacist
Physical/Occupational/Rehabilitation Therapist
Physician Assistant
Public Health Dentist
Public Health/Preventive Medicine Physician
Registered Nurse - Public Health or Community Health Nurse
Registered Nurse - Unspecified
Social Worker/Social Services Professional
Public Health Programs, Research, Assessment, & Surveillance
Animal Control Worker
Data or Research Analyst
Data Scientist
Disease Intervention Specialist/Contact Tracer
Economist
Emergency Preparedness/Management Worker
Engineer
Environmental Science and Protection Specialist
Environmental Science and Protection Technician
Epidemiologist
Health Communications Specialist
Health Educator
Health Navigator
Laboratory Aide or Assistant
Laboratory Quality Control Worker
Laboratory Scientist/Medical Technologist
Laboratory Technician
Licensure/Regulation/Enforcement Worker
Medical/Vital Records Staff
Other Health Communications Professional
Other Laboratory Professional
Other Program Staff
Other Public Health Science Professional
Policy Analyst
Population Health Specialist
Program Coordinator
Program Director
Program Evaluator
Public Health Informatics Specialist
Public Health Manager or Program Manager
Public Health Veterinarian
Public Information Officer
Public Information Specialist
Sanitarian or Inspector
Statistician
Other
Other (please specify)
Student, Professional or Scientific
Q2. Please identify the classification that best represents your current role in the organization. This question refers to the type of role you serve in. This is NOT the same as your union/civil service title. You will be asked about your program area in the next question. Some job classifications are listed differently than you’d expect. For example, contact tracer can be found under “Disease Intervention Specialist/Contact Tracer.”
- Animal Control Worker
- Attorney or Legal Counsel
- Business Support - Accountant/Fiscal
- Business Support services – Administrator
- Clerical Personnel - Administrative Assistant
- Clerical Personnel – Secretary
- Communications
- Community Health Worker
- Custodian
- Customer Service/Support Professional
- Data or Research Analyst
- Database Manager
- Disability Claims/Benefits Examiner or Adjudicator
- Disease Intervention Specialist/Contact Tracer
- Department/Bureau Director
- Deputy Director
- Economist
- Emergency Medical Technician/Advanced Emergency Medical Technician/Paramedic
- Emergency Preparedness/Management Worker
- Engineer
- Environmental Science and Protection Specialist
- Environmental Science and Protection Technician
- Epidemiologist
- Grants or Contracts Specialist
- Health Educator
- Health Navigator
- Health Officer
- Human Resources Personnel
- Information Systems Manager/Information Technology Specialist
- Laboratory Aide or Assistant
- Laboratory Technician
- Laboratory Quality Control Worker
- Laboratory Scientist/Medical Technologist
- Licensed Practical or Vocational Nurse
- Licensure/Regulation/Enforcement Worker
- Mental Health or Substance Abuse Counselor
- Medical Examiner
- Medical/Vital Records Staff
- Nurse Practitioner
- Home Health Aide
- Nutritionist or Dietitian
- Other Behavioral Health Professional
- Other Business Support Services
- Other Facilities or Operations Worker
- Other Health Professional/Clinical Support Staff
- Other Oral Health Professional
- Other Program Staff
- Peer Counselor
- Pharmacist
- Physician Assistant
- Physical/Occupational/Rehabilitation Therapist
- Policy Analyst
- Population Health Specialist
- Program Coordinator
- Program Director
- Program Evaluator
- Public Health Agency Director
- Public Health Dentist
- Public Health Manager or Program Manager
- Public Health/Preventive Medicine Physician
- Public Health Veterinarian
- Public Health Informatics Specialist
- Public Information Specialist
- Quality Improvement Worker
- Registered Nurse - Public Health or Community Health Nurse
- Registered Nurse – Unspecified
- Sanitarian or Inspector
- Social Worker/Social Services Professional
- Statistician
- Student, Professional or Scientific
- Other (please specify)
Q2b. [Show if ANY other] Please specify _________
Program Area
Respondents selected their program area(s) from a list of 45 programs. Participants’ primary program was determined based on the percentage of time working in each selected program area. "Other" responses were recoded into the appropriate category. Understanding this information is important for assessing the workforce’s strengths and priorities and presents an opportunity to enhance collaboration to maximize the impact of public health initiatives.
Data was analyzed to reflect program area categories that align with the Foundational Public Health Services framework. Below is the crosswalk of program area to the program area categories.
Assessment & Surveillance
Community Health Assessment/Planning
Disability Services, including Disability Determinations
Enforcement/Inspection/Licensing/Certification of Facilities (includes health care facilities, long-term care facilities, nursing homes, and child care facilities)
Epidemiology Surveillance
Informatics
Medical Examiner
Public Health Genetics
Public Health Laboratory
Vital Records
Chronic Disease & Injury Prevention
Health Promotion/Wellness
Injury/Violence Prevention
Non-Communicable Disease/Chronic Disease (including cancer, diabetes, heart disease, obesity, etc.)
Clinical Health Care & Social Services
Clinical Services (excluding TB, STI, family planning)
Emergency Medical Services
Immunizations - clinical services
Immunizations - non-clinical
Mental and Behavioral Health
Oral Health/Clinical Dental Services
School Health
Substance Abuse, including tobacco control programs
Communicable Disease Control
Communicable/Infectious Disease - HIV
Communicable/Infectious Disease - Influenza
Communicable/Infectious Disease - STI
Communicable/Infectious Disease – Tuberculosis
Communicable/Infectious Disease - Viral Hepatitis
COVID-19 Recovery
Other Communicable/Infectious Disease
Communications & Policy
Communications/Public Information
Health Education
Policy, Legislation, and Government Affairs
Emergency Preparedness & Response
Emergency Preparedness, Planning, and Response
Environmental Public Health
Animal Control
Environmental Health
Maternal, Child, & Family Health
Children and Youth with Special Health Care Needs
Maternal, Child, and Adolescent Health
Maternal, Child, and Adolescent Health - Family Planning
Maternal, Child, and Adolescent Health - WIC
Organizational Competencies
Administration/Administrative Support
Equity/Health Equity
Financial Management, Contract, and Procurement
Information Technology (IT) Services
Program Evaluation
Training/Workforce Development
Other
Global Health
Other Program Area (specify)
Filter Option: Did you know you could filter by this item? Try filtering by Program Area or refining your population to a specific Workforce Group.
Workforce Groups
Workforce groups are defined by a combination of responses to questions on program area and job classification, as well as education and certifications. Below is how each workforce group was defined.
Emergency Preparedness & Response
- Program Area: Emergency Preparedness
- Job Classification: Emergency Preparedness/Management Worker
Chronic Disease
- Program Area: Non-Communicable/Chronic Disease
Environmental Health
- Program Area: Environmental Health
- Job Classification: Environmental Health Worker
Epidemiology
- Program Area: Epidemiology Surveillance
- Job Classification: Epidemiologist
Infectious/Communicable Disease
- Program Area:
- Communicable/Infectious Disease - HIV
- Communicable/Infectious Disease - STI
- Communicable/Infectious Disease - Tuberculosis
- Communicable/Infectious Disease - Influenza
- Communicable/Infectious Disease - Viral Hepatitis
- Other Communicable/Infectious Disease
Maternal, Child, and Adolescent Health
- Program Area:
- Maternal, Child, and Adolescent Health
- Maternal, Child, and Adolescent Health - Family Planning
- Maternal, Child, and Adolescent Health - WIC
- Children and Youth with Special Health Care Needs
Communications Professionals
- Program Area: Communications/Public Information
- Job Classification:
- Health Educator
- Public Information Officer
- Other Health Communications Professional
- Health Communications Specialist
- Public Information Specialist
Nurses
- Job Classification:
- Other Nurse - Clinical Services (not in 2024)
- Registered Nurse - Public Health or Community Health Nurse
- Registered Nurse - Unspecified
- Home Health Aide
- Licensed Practical or Vocational Nurse
- Nurse Practitioner
- Educational Attainment:
- Associate's degree in nursing
- BSN
- MSN
- DNP
- Certifications
- Nurse certification
Laboratory Professionals
- Job Classification:
- Laboratory Aide or Assistant
- Laboratory Technician
- Laboratory Quality Control Worker
- Laboratory Scientist/Medical Technologist
- Other Laboratory Professional
- Program Area: Public Health Laboratory
- Certification: Laboratory Certification
Community Health Workers
- Job Classification: Community Health Worker
- Certification: Certified Community Health Worker
Q3. Please specify your current program area(s). Select all that apply. Some programs are listed differently than you'd expect. For example, WIC can be found under “Maternal and Child Health – WIC". If you are serving in a COVID response role, please select “COVID-19 Recovery.” If you are only partially serving in that COVID response role, please select “COVID-19 Recovery” along with any other program area that you are also currently serving in.
- Administration/Administrative Support
- Animal Control
- Children and Youth with Special Health Care Needs
- Clinical Services (excluding TB, STI, family planning)
- Communicable/Infectious Disease – HIV
- Communicable/Infectious Disease – Influenza
- Communicable/Infectious Disease - STI Communicable/Infectious Disease – Tuberculosis
- Communicable/Infectious Disease - Viral Hepatitis
- Other Communicable/Infectious Disease
- Communications/Public Information
- Community Health Assessment/Planning
- COVID-19 Recovery
- Disability Services, including Disability Determinations
- Emergency Medical Services
- Emergency Preparedness, Planning, and Response
- Enforcement/Inspection/Licensing/Certification of Facilities (includes health care facilities, long-term care facilities, nursing homes, and child care facilities)
- Environmental Health
- Epidemiology Surveillance
- Equity/Health Equity
- Global Health
- Health Education
- Health Promotion/Wellness
- Immunizations - clinical services
- Immunizations - non-clinical
- Informatics Information Technology (IT) Services
- Injury/Violence Prevention
- Maternal, Child, and Adolescent Health
- Maternal, Child, and Adolescent Health - Family Planning
- Maternal, Child, and Adolescent Health – WIC
- Medical Examiner
- Mental and Behavioral Health
- Non-Communicable Disease/Chronic Disease (including cancer, diabetes, heart disease, obesity, etc.)
- Oral Health/Clinical Dental Services
- Policy, Legislation, and Government Affairs
- Program Evaluation
- Public Health Genetics
- Public Health Laboratory
- School Health
- Substance Abuse, including tobacco control programs
- Training/Workforce Development
- Vital Records
- Other Program Area (specify)
Q3b. [Carryforward program area responses from the previous question] Items shown are those you selected in the previous question. Please estimate the % time you currently serve in each of those program areas. (Your total should add up to 100%, regardless of whether you are a full-time or part-time employee.)
- Program Area 1 _________%
- Program Area 2 _________ %
- Program Area 3 _________ %
- ...
Full-time/Part-time
Respondents were asked to indicate whether they are full-time or part-time employees. Understanding the distribution of full-time and part-time employees provides an opportunity to enhance employee engagement strategies, ensuring that all employees are effectively supported and recognized.
Filter Option: Did you know you could filter by this item? Try filtering by Full-time/Part-time or refining your population to full-time or part-time employees to view your PH WINS data in a different way. Learn more about how to use the filters here.
Q8. Are you currently employed full-time at the public health department?
- Yes
- No
Tenure in Position, Agency, and Public Health Practice
Respondents were asked to indicate their tenure in their position, agency, and public health practice. Understanding how many employees bring new talent (0-5 years in their role) versus seasoned experience (21 or more years) helps assess workforce composition. Similarly, tenure within an agency provides insight into retention and institutional knowledge. Understanding tenure across these areas presents an opportunity to foster mentorship programs that bridge generations and enhance workforce impact.
Filter Option: Did you know you could filter by this item? Try filtering by Tenure in Agency or refining your population to 0-5 years, 6-10 years, 11-15 years, 16-20 years, or 21 or above to view your PH WINS data in a different way. Learn more about how to use the filters here.
Q4. Please move the sliders to indicate how long you have been in each of the following (in years). Please round to the nearest year.
- In your current position _________
Q4. Please move the sliders to indicate how long you have been in each of the following (in years). Please round to the nearest year.
- With your current agency in total (in any position) _________
Q4. Please move the sliders to indicate how long you have been in each of the following (in years). Please round to the nearest year.
- In public health practice in total (in any agency, in any position) _________
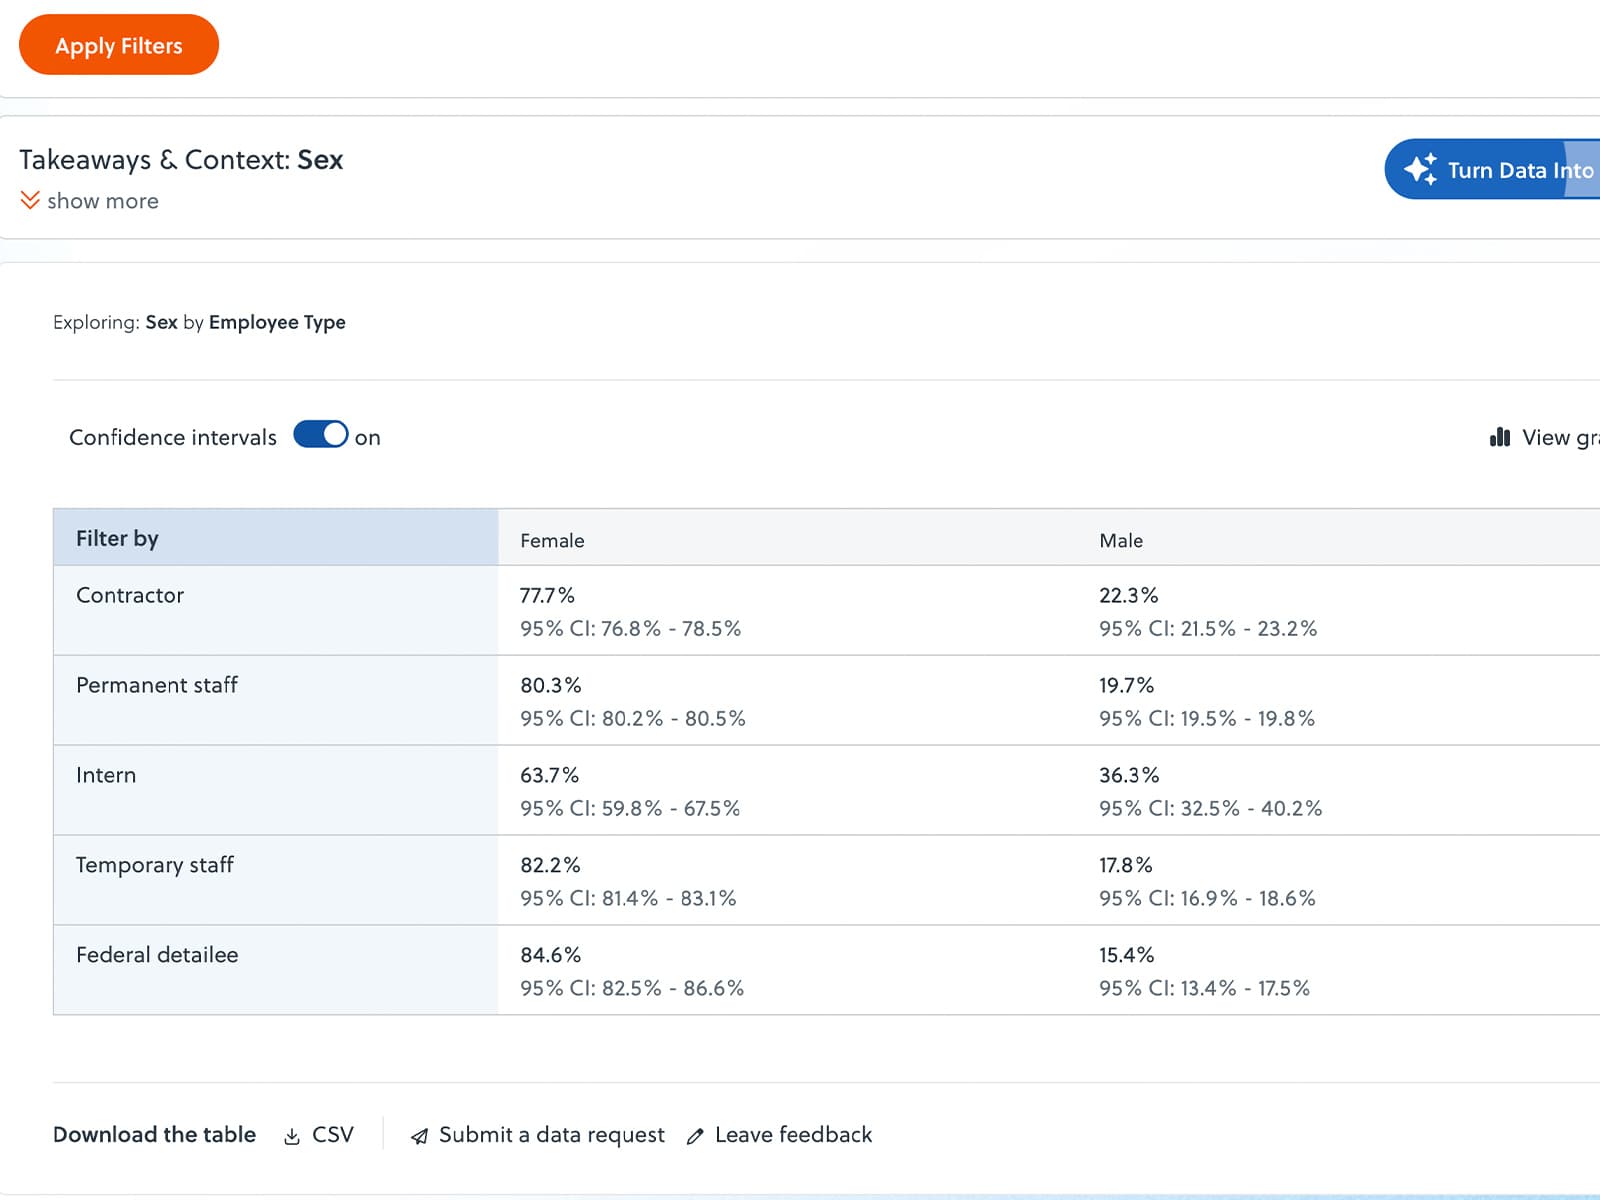
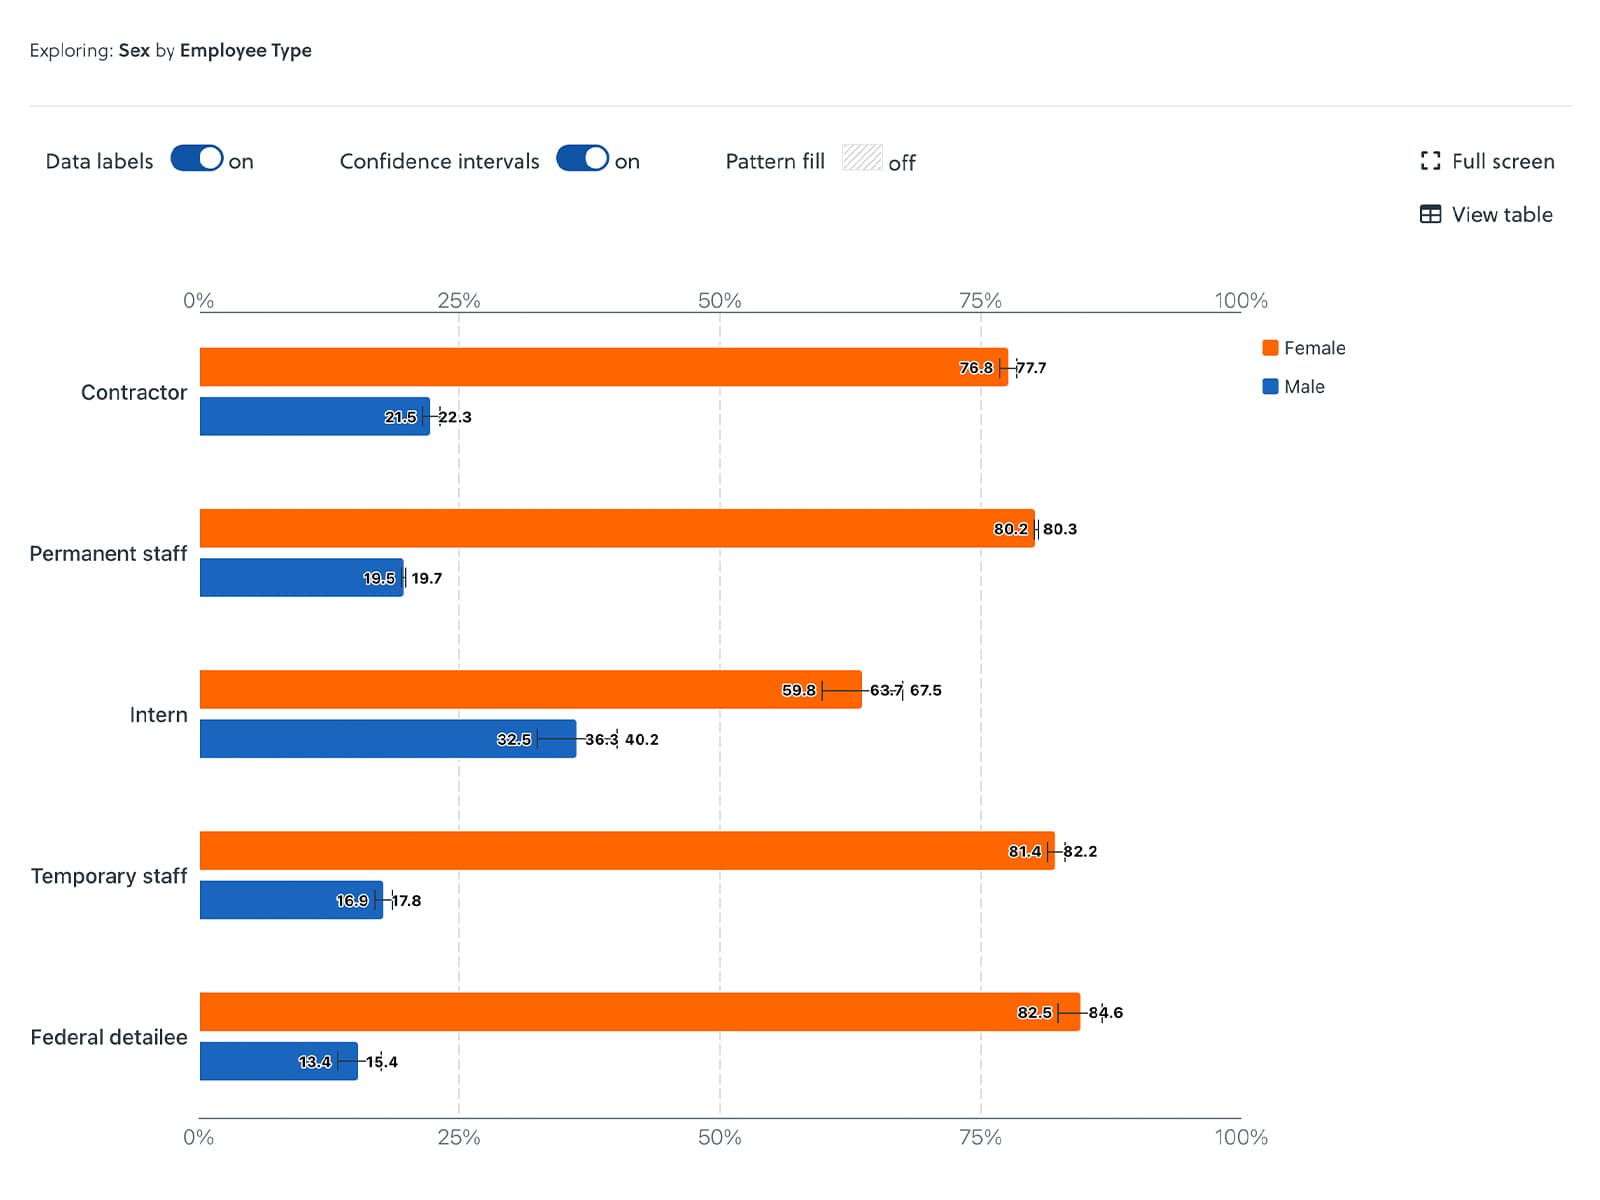
Employee Type
Respondents were asked to indicate their current employment status. Understanding the composition of permanent health department staff, interns, temporary staff, contractors, and federal detailees provides insight into workforce structure. This information presents an opportunity to invest in long-term professional development and institutional knowledge-building to further strengthen the health department’s capacity.
Combined view note: If you are seeing a combined view, it means that a subcategory has fewer than 10 responses and has been grouped into a broader category to protect respondent confidentiality. Individual subcategories did not meet the minimum reporting threshold and were combined to maintain privacy while still providing meaningful workforce insights.
Filter Option: Did you know you could filter by this item? Try filtering by Employee Type or refining your population to contractor, permanent staff, intern, temporary staff, or federal detailee to view your PH WINS data in a different way. Learn more about how to use the filters here.
Q6. Which of the following best describes your current employment status?
- Contractor providing third party services to the health department
- Permanent staff employed directly by the health department
- Intern employed directly by the health department
- Federal employee assigned to the health department
- Temporary staff employed directly by the health department
- Public Health AmeriCorps member serving at the health department
Union Position
Respondents were asked to indicate if their current position is a bargaining unit (union) position using the following question.
Filter Option: Did you know you could filter by this item? Try filtering by Union Position or refining your population to non-union or union to view your PH WINS data in a different way. Learn more about how to use the filters.
Q7. Is your current position a bargaining unit (union) position?
- Yes
- No
Annualized Salary
Respondents were asked to indicate whether their pay is based on an annual salary or hourly wage. Those who selected annual salary were asked to report their current salary. Understanding salary distribution among employees helps evaluate pay structures and supports efforts to ensure fair and competitive compensation for all employees.
Filter Option: Did you know you could filter by this item? Try filtering by Annualized Salary or refining your population to less than $55,000, $55,000.01 - $85,000, $85,000.01 - $115,000, or more than $115,000 to view your PH WINS data in a different way. Learn more about how to use the filters here.
Q33. Is your pay based on an annual salary or hourly wage?
- Annual salary
- Hourly wage
Q33b. [Display if annual] What is your current annual salary?
- Less than $25,000
- $25,000 - $35,000
- $35,000.01 - $45,000
- $45,000.01 - $55,000
- $55,000.01 - $65,000
- $65,000.01 - $75,000
- $75,000.01 - $85,000
- $85,000.01 - $95,000
- $95,000.01 - $105,000
- $105,000.01 - $115,000
- $115,000.01 - $125,000
- $125,000.01 - $135,000
- $135,000.01 - $145,000
- More than $145,000
Engagement & Satisfaction
The Engagement & Satisfaction topic examines the workforce’s satisfaction with and perceptions of the workplace, supervisors, and organization.
Job Satisfaction
Respondents were asked to rate their level of agreement with statements about their satisfaction with their job, pay, and benefits. Understanding these metrics provides insight into workforce climate and culture. Fostering a supportive work environment can help improve retention and enhance productivity.
Q10. Please rate your level of agreement with the following items
| Strongly disagree | Disagree | Agree | Strongly agree | |
|---|---|---|---|---|
| I am satisfied with my job. | ||||
| I am satisfied with my pay. | ||||
| I am satisfied with my benefits. |
Organizational Satisfaction
Respondents were asked to rate their level of agreement with the statements about their satisfaction with their organization, unit, and supervisor. Understanding these metrics provides insight into the well-being of an organization’s culture.
Q10. Please rate your level of agreement with the following items
| Strongly disagree | Disagree | Agree | Strongly agree | |
|---|---|---|---|---|
| I am satisfied with my organization. | ||||
| I am satisfied with my work unit. | ||||
| I am satisfied with my supervisor. |
Thriving from Work
Respondents were asked to indicate the frequency of their agreement with the statements shown. These data assess whether employees are thriving in key areas, including job satisfaction, fair treatment and compensation, work-life balance, autonomy, communication, and psychological safety. Understanding employee well-being helps identify areas of success and opportunities for improving workplace culture. These items are a validated tool known as Thriving from Work.
Q9. The following items relate to how you perceive your work day-to-day. Please indicate how often, if at all, you generally felt that way about your work over the last month.
| Never | Rarely | Sometimes | Usually | Almost Always | Always | |
|---|---|---|---|---|---|---|
| I love my job. | ||||||
| I am treated fairly at work. | ||||||
| I can achieve a healthy balance between my work and life outside of work. | ||||||
| I am paid fairly for the job that I do. | ||||||
| I am happy with how much input I have in decisions that affect my work. | ||||||
| I can easily manage the demands of my job. | ||||||
| I feel psychologically safe at work. | ||||||
| I can voice concerns at work without getting into trouble. |
Peters, S.E., Gundersen, D.A., Katz, J.N., Sorenson, G., Wagner, G.R., Thriving from Work Questionnaire: Dimensionality, Reliability, and Validity of the Long and Short Form Questionnaire. Am. J. Ind. Med. 2023; 66: 281-296. doi:10.1002/ajim.23465
Belonging
Respondents were asked to indicate their level of agreement with the statements shown below. Understanding employee’s sense of belonging is important for evaluating and strengthening workplace culture.
Q12. Please rate your level of agreement with the following items.
| Strongly disagree | Disagree | Agree | Strongly agree | |
|---|---|---|---|---|
| I feel a sense of belonging within my work unit. | ||||
| I feel a sense of belonging at my agency. |
Staying & Leaving
The Staying & Leaving topic examines the workforce’s plans to stay at or leave the organization and their reasons for doing so.
Leaving, Retiring, or Staying
Respondents were asked to indicate whether they are considering leaving their organization within the next year. Understanding reported intensions to leave provides valuable insights for assessing retention strategies and succession planning.
Filter Option:Did you know you could filter by this item? Try filtering by Staying & Leaving or refining your population to staying, leaving in one year, or retiring in one year to view your PH WINS data in a different way. Learn more about how to use the filters here.
Q16. Are you considering leaving your organization within the next year?
- Yes
- No
Plans after Leaving
Respondents who indicated they are considering leaving their organization within the next year were asked the following question. Understanding the intensions of those planning to leave can help inform retention strategies and identify opportunities for career development.
Q16b. If yes, what are you planning to do?
- Retire
- Pursue further education
- Take another governmental job in public health
- Take another governmental job not in public health
- Take a non-governmental job in public health
- Take a non-governmental job not in public health
- Leave the workforce
Reasons for Leaving
Respondents who indicated they are considering leaving their organization within the next year were asked the following question. Understanding these factors presents an opportunity to address workplace concerns, strengthen retention efforts, and foster an environment that encourages employees to stay.
Q17a. Please select the most important reason(s) why you are considering leaving your organization.
- Better opportunities outside of the agency
- Job instability (e.g., loss of funding, reduction in force (RIF), layoffs)
- Job satisfaction
- Lack of acknowledgement/recognition
- Lack of flexible work schedule (e.g., flex hours)
- Lack of opportunities for advancement
- Lack of support from coworkers
- Lack of training
- Leadership changeover
- Organizational climate/culture
- Pay
- Reasons unrelated to my job (e.g., family obligations, health reasons, lack of affordable child-care options, moving, etc.)
- Remote work policies
- Retirement
- Satisfaction with your supervisor
- Stress
- Weakening of benefits (e.g., retirement contributions/pensions, health insurance)
- Work overload / burnout
- Other (Please Specify)
Reasons for Staying
Respondents who indicated they are not leaving their organization within the next year were asked the following question. Understanding these factors highlights organizational strengths and provides a foundation to further enhance employee engagement, recruitment, and retention efforts.
Q17. Please select the most important reason(s) why you are staying at your organization.
- Acknowledgement/recognition for your work
- Benefits (e.g., retirement contributions/pensions, health insurance)
- Exciting and challenging work
- Flexible work schedule (e.g., flex hours)
- Job satisfaction
- Job stability
- Lack of stress
- Mentorship opportunities
- Opportunities for advancement
- Organizational climate/culture
- Pay
- Pride in the organization and its mission
- Remote work policies
- Satisfaction with your agency’s leadership (e.g., Health Commissioner, Senior Deputy, etc.)
- Satisfaction with your supervisor
- Support from coworkers
- Training opportunities
- Unsatisfactory opportunities outside of the agency
- Other (please specify)
Workplace Well-being
The Well-Being topic examines the well-being of the workforce, including their general mental and emotional well-being, burnout, fairness, and sense or organizational support for well-being.
Mental Health
Respondents were asked to rate their mental or emotional health. Examining employee well-being helps identify opportunities to prioritize mental health support and resources, fostering a healthier and more resilient workplace.
Q14. In general, how would you rate your mental or emotional health? (No forced response)
- Excellent
- Very good
- Good
- Fair
- Poor
Burnout
Respondents were asked to describe their current level of burnout based on their experience with burnout symptoms. Understanding burnout levels can help decision-makers prioritize strategies to reduce its impact, such as promoting work-life balance, enhancing mental health resources, and fostering a supportive work environment.
Q15. Burnout is a state of physical, mental, and emotional exhaustion caused by excessive stress, particularly in the workplace. It is characterized by a range of symptoms including:
- Physical symptoms: exhaustion, fatigue, or headaches
- Mental symptoms: depression, excessive worrying, or frustration
- Behavioral symptoms: short temper or quiet quitting
Based on the definition of burnout provided above, how would you describe your current level of burnout?
- I have no symptoms of burnout
- I have one or more symptoms of burnout that come and go away
- I have one or more symptoms of burnout that won’t go away
- I am completely burnt out, my symptoms won’t go away
Fairness
Respondents were asked to rate their level of agreement with the following statements. Employees' perceptions of fairness related to age, race, gender, and sexual orientation are essential for fostering an inclusive workplace. Addressing these perceptions can strengthen workplace culture, promote inclusivity, and enhance overall employee satisfaction.
Q11. Please rate your level of agreement with the following items.
| Strongly disagree | Disagree | Agree | Strongly agree | |
|---|---|---|---|---|
| People here are treated fairly regardless of their age. | ||||
| People here are treated fairly regardless of their race. | ||||
| People here are treated fairly regardless of their gender. | ||||
| People here are treated fairly regardless of their sexual orientation. |
Policies & Practices
Respondents were asked to rate their level of agreement with the following statements. Understanding perceptions of how an organization's policies and practices support work-life balance and well-being can help identify areas for improvement and strengthen initiatives aimed at promoting work-life balance, preventing burnout, and enhancing overall employee well-being.
Q25. Please rate your level of agreement with the following items:
| Strongly disagree | Disagree | Agree | Strongly agree | |
|---|---|---|---|---|
| I feel comfortable using my paid time off. | ||||
| My agency implements policies and practices that support my mental wellbeing. |
Workload
Respondents were asked to rate their level of agreement with the following statements. Evaluating employee perceptions of workload appropriateness can help leaders and supervisors identify workload challenges and develop strategies to prevent overburdening, promote a healthier work environment, and enhance job satisfaction.
Q25. Please rate your level of agreement with the following items:
| Strongly disagree | Disagree | Agree | Strongly agree | |
|---|---|---|---|---|
| I am able to complete my work within my normal working hours (e.g., 40 hours/week for full time employees). | ||||
| I have to take on responsibilities outside of my job description. |
Training
The Training topic examines training needs, strengths, and interests of employees, as well as the support they need to seek training.
Training Needs and Strategic Strengths
Respondents were asked to rate their own proficiency with skills identified as very important or moderately important to their work, tailored to their supervisory level. The items have been adapted from multiple frameworks and competency models and are organized to reflect 9 domains of the Strategic Skills for Public Health: Effective Communication; Data-Based Decision Making; Budget & Financial Management; Change Management; Systems and Strategic Thinking; Community Engagement; Cross-Sectoral Partnerships; and Policy Engagement is included as well to understand an employee’s subject matter and technical expertise.
A training need is defined as skill that is of high importance and low proficiency. Addressing these training needs will help foster a more skilled workforce and improve overall performance.
A strategic strength is defined as skill that is of high importance and high proficiency. Leveraging these strengths can maximize performance, foster a culture of excellence, and promote leadership.
| Considering your role, how important is this item in your work? | What is your current skill level for this item? | ||||||
|---|---|---|---|---|---|---|---|
| Not important | Somewhat important | Moderately important | Very important | Unable to perform | Beginner | Proficient | Expert |
Please note, skill levels are defined as follows:
- Unable to perform: lacking the necessary skills to perform
- Beginner: able to perform with assistance
- Proficient: able to perform independently
- Expert: able to assist or teach others
Skill-Building Interests
Respondents were asked to select the skills they would most like to receive training on, based on the skills they identified as very important in the training needs and strategic strengths question. Identifying these training interests can help organizations support employee growth and strengthen overall workforce capabilities.
Q21. Items shown are those you identified as "Very Important" to your current position from the last three pages. Select the most important item you would seek training on given your current responsibilities.
Support for Training
Respondents were asked to rate their level of agreement with the following statements. Understanding employee perceptions of the time and resources available for training provides an opportunity to improve access to professional development, empower employees to enhance their skills, and foster a culture of continuous learning.
Q22. Please rate your level of agreement with the following statements:
| Strongly disagree | Disagree | Agree | Strongly agree | |
|---|---|---|---|---|
| My agency provides me with time to address my training needs. | ||||
| My agency provides me with resources to address my training needs. |
Flexibility & Benefits
The Flexibility & Benefits topic examines the current and preferred work situation of employees as well as the importance of non-traditional benefits such as flexible work time, financial benefits, and caregiver support.
Current Remote Status
Respondents were asked to indicate their current work situation using the following question.
Filter Option: Did you know you could filter by this item? Try filtering by Current Remote Status or refining your population to: currently in-person; currently mostly in person- some remote; currently mostly remote, some in person; or currently remote to view your PH WINS data in a different way. Learn more about how to use the filters here.
Q23. Which of the following best describes your current work situation?
- Completely in-person
- Mostly in-person, with some remote work
- Mostly remote, with some in-person work
- Completely remote
Preferred Remote Status
Respondents were asked to indicate their preferred work situation. Understanding employees’ current and preferred work situations can help identify flexible work options that align with employee preferences and support recruitment and retention efforts.
Q24. Considering your role, which of the following best describes your preferred work situation?
- Completely in-person
- Mostly in-person, with some remote work
- Mostly remote, with some in-person work
- Completely remote
Flexible Worktime
Respondents were asked to rate how important they felt it was for their organization to offer benefits related to flex time and ad-hoc remote work. Understanding employees' perceptions of these benefits provides an opportunity to incorporate flexible work options into workplace policies, which can support work-life balance and strengthen recruitment and retention efforts.
Q26. Below is a list of non-traditional employee benefits that may or may not be currently offered at your agency. Please rate how important you feel it is that your agency provides each benefit to employees.
| Not important | Somewhat important | Moderately important | Very important | |
|---|---|---|---|---|
| Flextime (flexibility in arrival, departure, and/or lunch times) | ||||
| Ad-hoc remote work (a portion of work hours are completed offsite on an ad hoc basis e.g., ability to work from home when your child is sick or you have an appointment) |
Financial Benefits
Respondents were asked to rate how important they felt it was for their organization to offer benefits related to professional development funds, tuition assistance, and student loan repayment or forgiveness. Understanding employees' perceptions of these benefits provides agencies with opportunities to explore tuition assistance and student loan repayment programs as strategies to strengthen recruitment and retention efforts, support employee growth, and reduce financial burdens.
Q26. Below is a list of non-traditional employee benefits that may or may not be currently offered at your agency. Please rate how important you feel it is that your agency provides each benefit to employees.
| Not important | Somewhat important | Moderately important | Very important | |
|---|---|---|---|---|
| Professional development funds | ||||
| Tuition assistance | ||||
| Student loan repayment/forgiveness |
Parent-Focused Support
Respondents were asked to rate how important they felt it was for their organization to offer caregiver support benefits, such as on-site childcare, backup childcare options, a childcare stipend, and lactation facilities. Providing these benefits can help alleviate employees' childcare challenges, support work-life balance, and strengthen recruitment and retention efforts.
Q26. Below is a list of non-traditional employee benefits that may or may not be currently offered at your agency. Please rate how important you feel it is that your agency provides each benefit to employees.
| Not important | Somewhat important | Moderately important | Very important | |
|---|---|---|---|---|
| Onsite childcare | ||||
| Back-up childcare options | ||||
| Childcare stipend | ||||
| Lactation facilities |
Community Engagement
The Community Engagement topic examines the workforce's commitment to infusing the community into its work, engaging community members, and collaborating with external organizations.
Infusing the Community into Work, Engaging Community Members, and Collaborating with External Organizations
Respondents were asked to rate their level of agreement with the statements related to each Community Engagement construct. The range of choices included strongly agree, agree, disagree, and strongly disagree. By exploring these constructs, health departments can:
- Understand how employees integrate the community into their work allowing for improved community outcomes and enhanced program impacts.
- Actively incorporate community perspectives to enhance public trust, better address local needs, and strengthen the overall impact of public health initiatives.
- Leverage these partnerships to support efforts that address community priorities, improve community engagement, and enhance the effectiveness of public health programs.
| Strongly disagree | Disagree | Agree | Strongly agree |